It’s hard to create effective interdisciplinary teams or facilitate useful interdisciplinary exchanges. Research grants are increasingly calling for interdisciplinary collaboration as a requirement for funding. Interdisciplinary endeavors are popping up in academic settings and research foundations. Interdisciplinarity is a necessity for solving complex problems. But executing interdisciplinary collaboration is easier said than done.

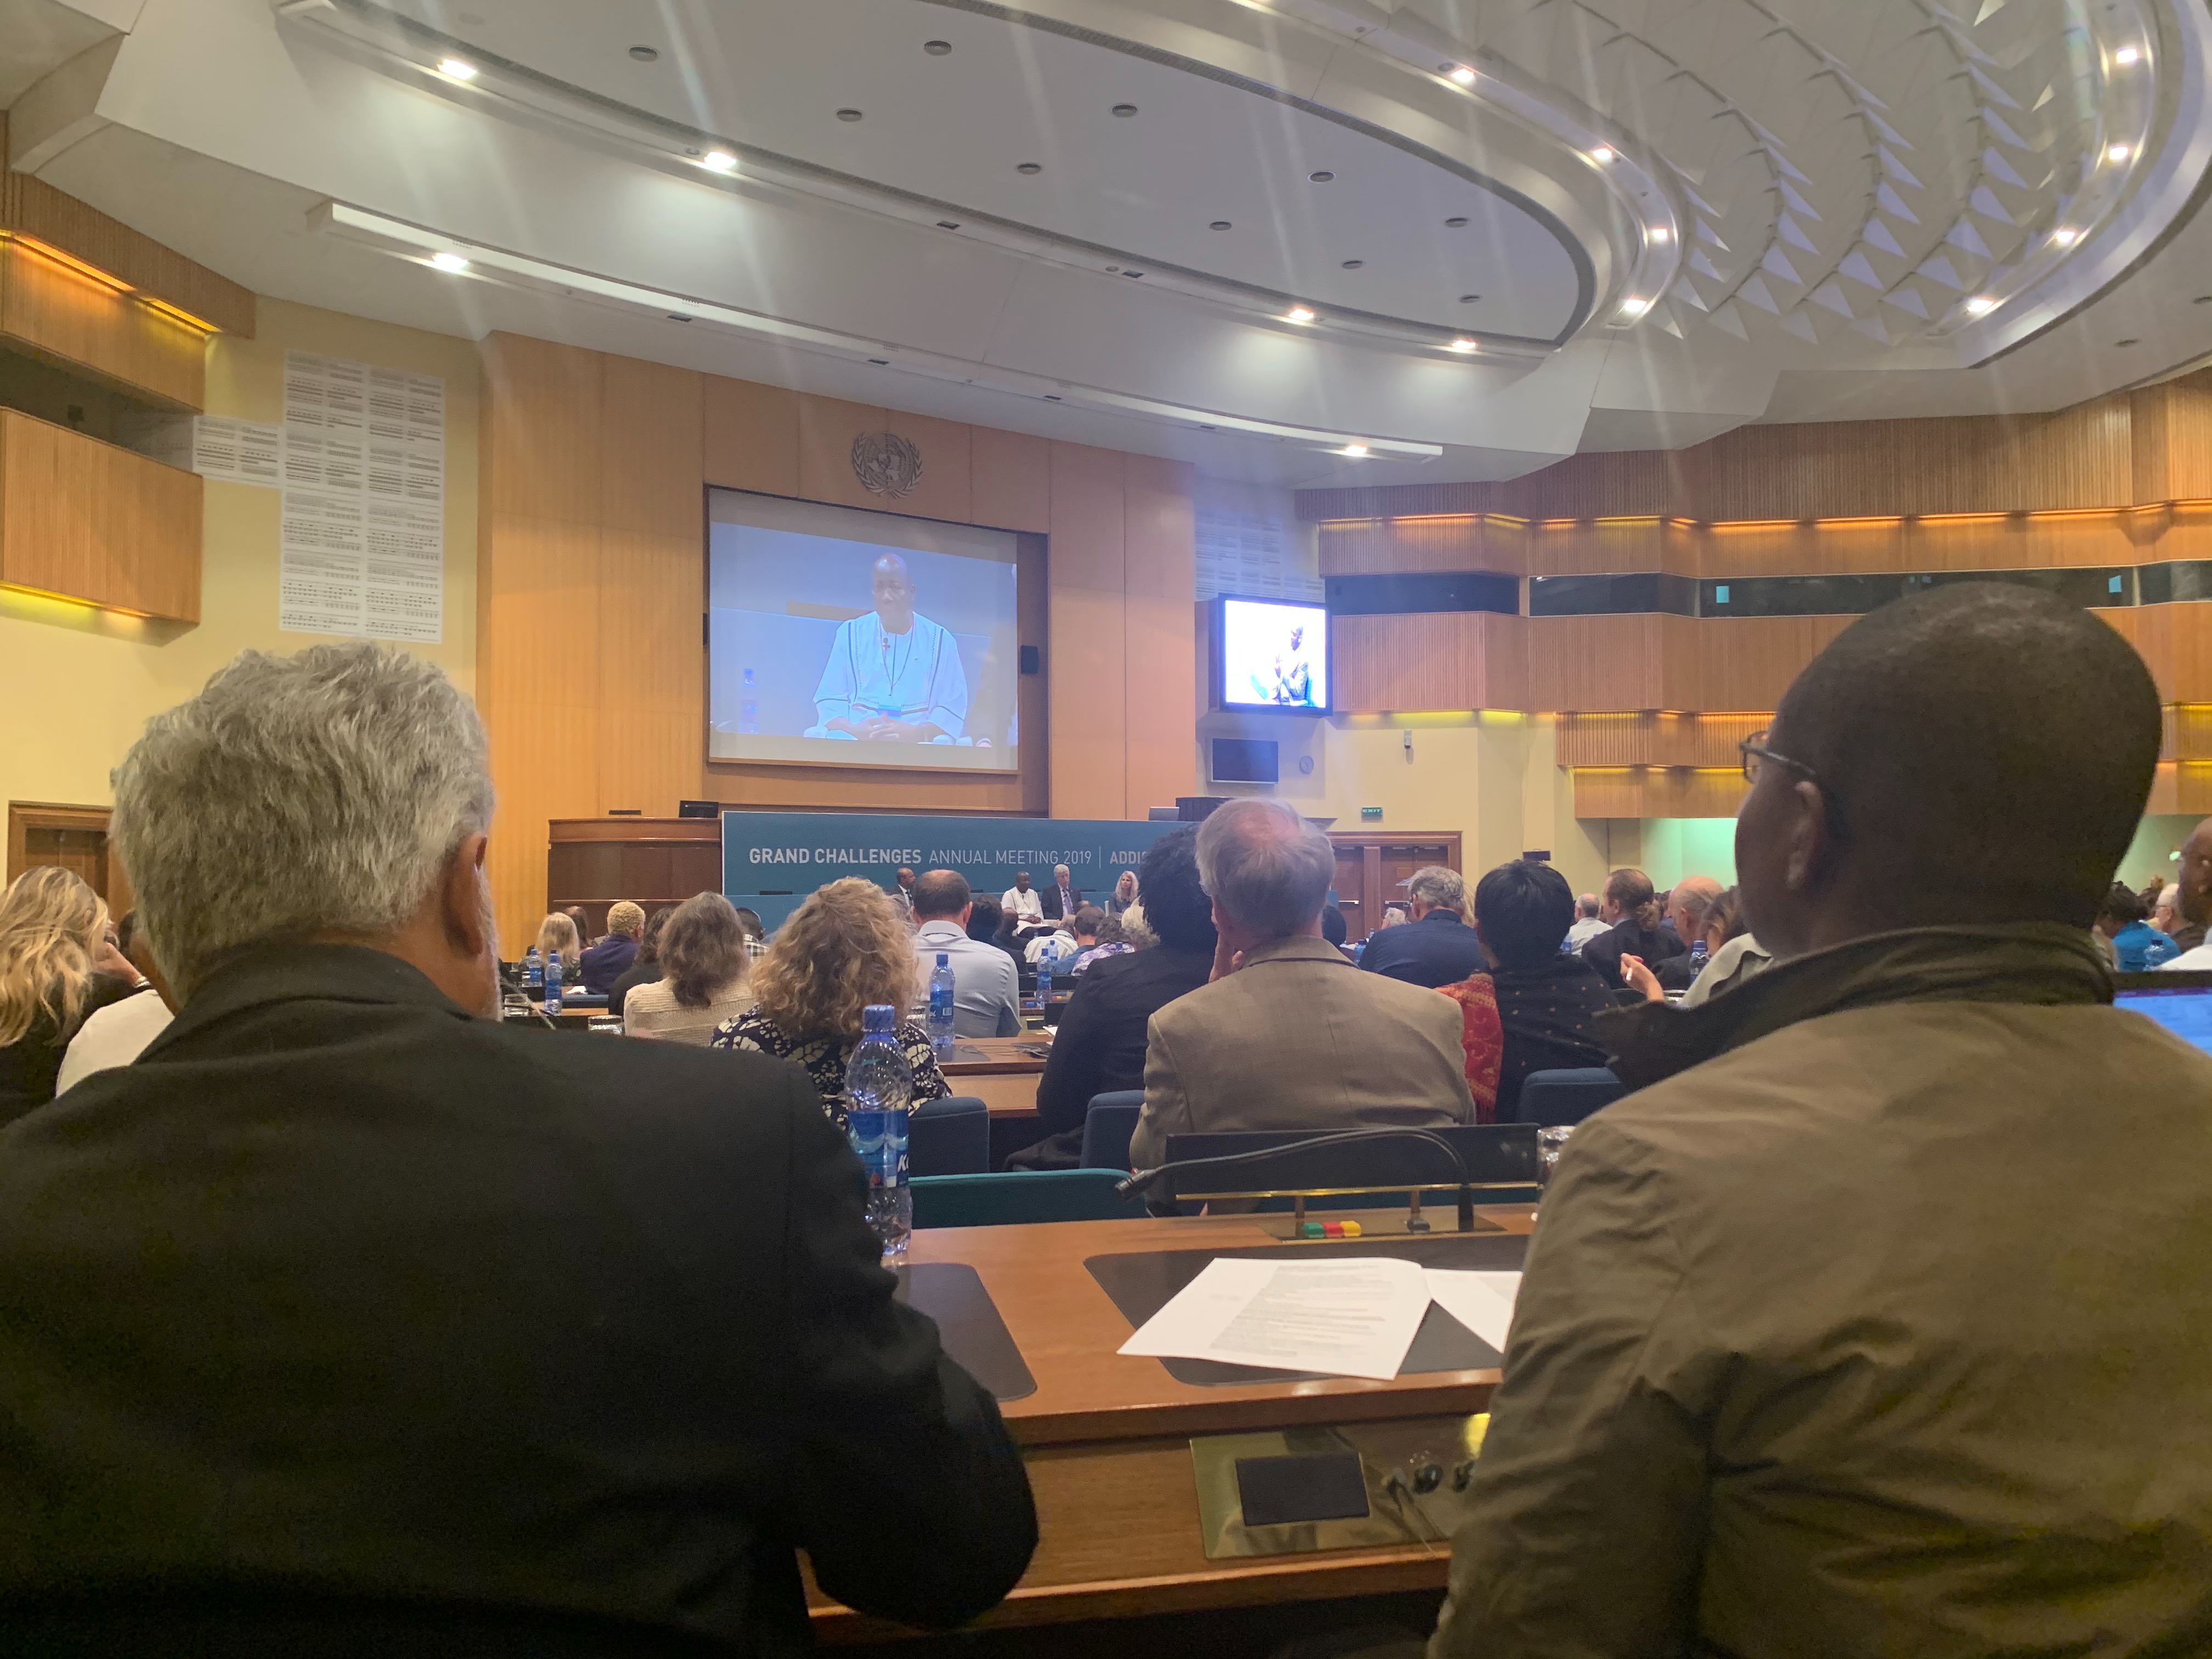
The view from the Grand Challenges Summit at the UN facility in Ethiopia, where the Gates Foundation and the African-Academy of Sciences hosted an interdisciplinary conference on Africa's biggest public health challenges.
Data science and data visualization can help, by identifying fruitful common ground between people with different expertise. Software can systematize effective interdisciplinary collaboration.
When it Goes Wrong and When it Goes Right
A researcher at a neuroscience institute described to us how the institute convened experts from numerous fields, but they barely talk. They speak different technical languages, have different methods and goals, and don’t know where to start.
We facilitated a discussion between a geneticist analyzing biomarkers for brain disease and a religious studies professor doing analytics on ancient islamic text. They were using a similar data visualization to analyze vastly different data. Once connected and informed about what they shared, a short discussion generated a lot of insight about each other and themselves, insight which formed part of a grant for the religious studies professor to continue his work with text analytics.
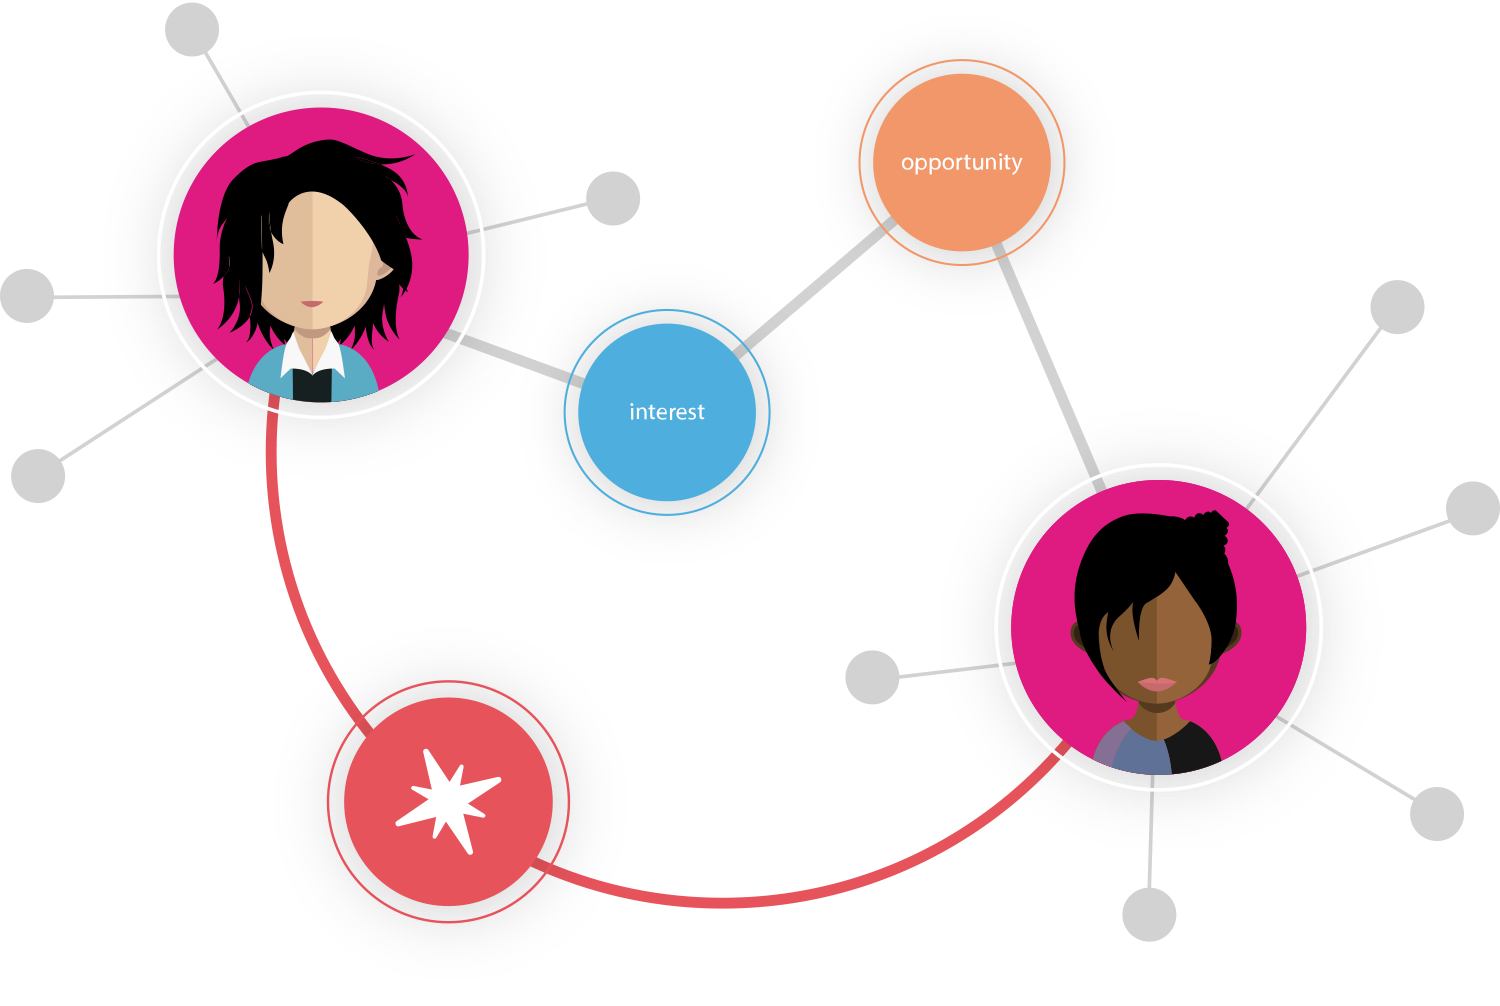
The positive impact of the interaction depended on identifying common ground. Complementary differences are the foundation of innovative interactions. Co-workers have complementary differences when they bring new expertise that can offer useful new perspective, but they have enough in common that they can communicate effectively with each other.
We created a 20-30 minute exercise that demonstrates the potential of finding complementary differences. It uses paper, pens, and sticky-notes. If you want to experiment with the idea of complementary differences in your organization or prove the concept to others, this exercise is a brief but immersive way to do it.
Complementary Differences as a Matter of Course
Paper and pen will not scale well, however. Software can process more data and subtler data about a community. It can offer data-driven insight into how to form teams and with whom to exchange perspective, and it can process data about how collaborations go and use it to improve.
You can walk through some of the tools and visualizations we use to facilitate interdisciplinary collaboration.

If you have a spreadsheet of data, we also offer a free visualization tool for understanding the overlap in your interdisciplinary community.
Comments